Monthly Grocery Budget by Household Size (2026)
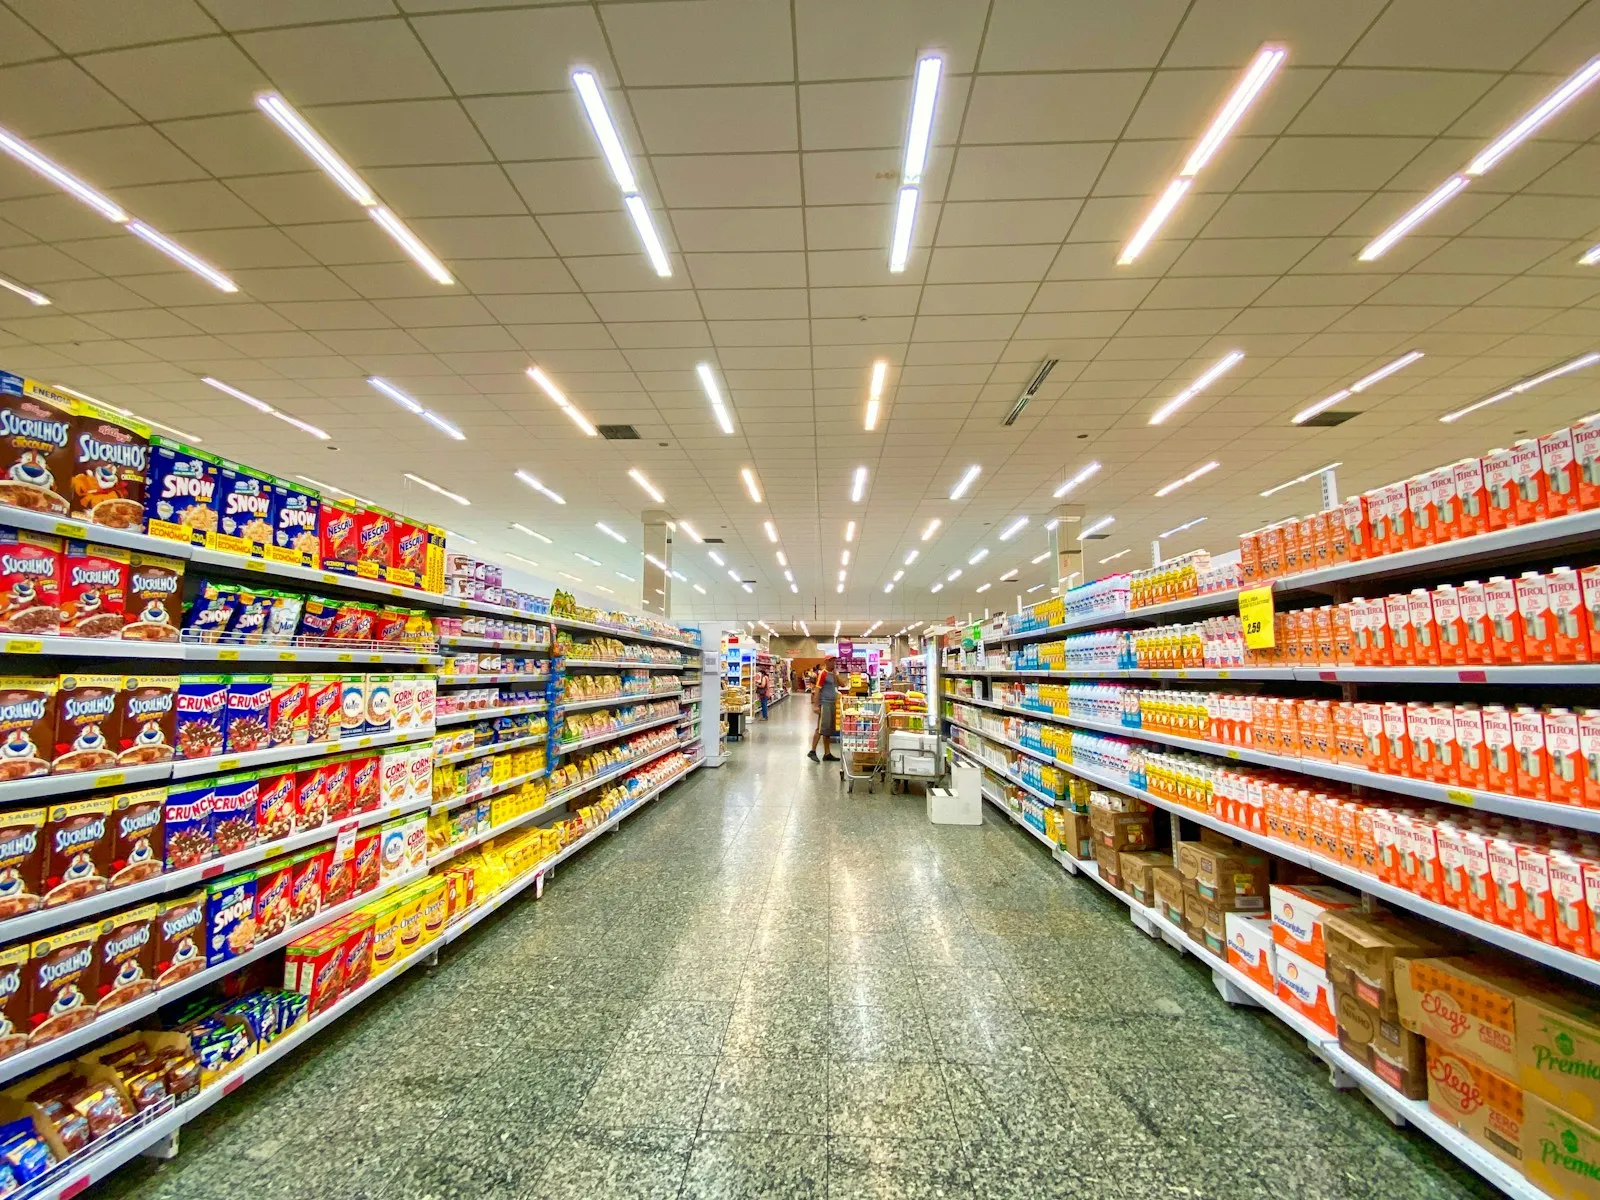
Photo by Nathália Rosa on Unsplash
One adult cooking every meal at home spends somewhere between $305 and $584 a month on groceries, according to the USDA’s September 2026 food plans. A couple: $630 to $1,008. A family of four: $1,024 to $1,682. Those ranges are where most “how much should I spend on groceries” answers come from, usually without saying so — or saying what the numbers leave out.
If you’re setting a monthly food budget for one, or checking whether your family’s grocery bill is out of line, the USDA tables are the best benchmark there is. They’re not an average grocery bill, though. They’re what a nutritious diet costs at four different spending levels, recalculated every month as food prices move. Here’s the full set by household, and how to compare your own spending against it.
The Four USDA Food Plans
The USDA publishes four plans, each a full week of meals priced at today’s grocery costs:
- Thrifty — the cheapest. It’s the plan the maximum SNAP benefit is based on.
- Low-Cost, Moderate-Cost and Liberal — the same idea with more expensive foods and more choice at each step up.
All four assume every meal and snack is made at home. The figures below come from the September 2026 reports, issued in October 2026, and they’re U.S. averages — the USDA publishes separate tables for Alaska and Hawaii, where food costs a lot more.
Monthly Grocery Cost by Household
| Household | Thrifty | Low-Cost | Moderate | Liberal |
|---|---|---|---|---|
| One woman, 19–50 | $305 | $332 | $404 | $516 |
| One man, 19–50 | $383 | $381 | $478 | $584 |
| Couple, 19–50 | $630 | $653 | $808 | $1,008 |
| Couple, 51–70 | $569 | $625 | $777 | $933 |
| One parent (woman, 19–50) and a child of 6–8 | $509 | $592 | $705 | $865 |
| Couple and a child of 4–5 | $799 | $812 | $1,004 | $1,244 |
| Family of four (children 6–8 and 9–11) | $1,024 | $1,127 | $1,389 | $1,682 |
| Family of five (children 2–3, 6–8 and 9–11) | $1,137 | $1,235 | $1,517 | $1,837 |
These already include the USDA’s household-size adjustment. Its base costs assume a four-person household, so it suggests adding 20% for one person, 10% for two and 5% for three, and subtracting 5% for five or six people and 10% for seven or more. Smaller households pay more per person, mostly because they lose the savings of buying in larger quantities.
You’ll notice one oddity: for an adult man, Thrifty costs slightly more than Low-Cost. That’s not a typo. The Thrifty plan was rebuilt in 2021 on newer data, while the other three still use a 2007 shopping list, so the plans don’t line up perfectly for every person.
Build Your Own Household
If your household isn’t in the table, add up each person’s monthly cost below, then apply the size adjustment above.
| Person | Thrifty | Low-Cost | Moderate | Liberal |
|---|---|---|---|---|
| Child, 2–3 | $173 | $174 | $207 | $252 |
| Child, 4–5 | $188 | $179 | $222 | $268 |
| Child, 6–8 | $209 | $262 | $305 | $357 |
| Child, 9–11 | $242 | $271 | $350 | $408 |
| Girl, 14–18 | $260 | $271 | $323 | $400 |
| Boy, 14–18 | $326 | $323 | $404 | $474 |
| Woman, 19–50 | $254 | $276 | $336 | $430 |
| Man, 19–50 | $319 | $318 | $398 | $487 |
| Woman, 51–70 | $236 | $269 | $331 | $400 |
| Man, 51–70 | $281 | $299 | $375 | $449 |
| Woman, 71+ | $261 | $268 | $330 | $394 |
| Man, 71+ | $268 | $296 | $364 | $448 |
The Thrifty plan draws its age lines a year later for teens and adults (14–19 and 20–50), which barely moves the numbers. A single dad with a 7-year-old, on the Moderate plan, works out like this: $398 + $305 = $703, plus 10% for a two-person household, is about $773 a month.
Which Plan Is Realistic for You
The plans differ in what goes in the cart, not just how much. A rough guide:
- Thrifty or Low-Cost if you buy mostly store brands, cook from scratch and rarely throw food away
- Moderate if your cart has a mix of name brands, some pre-cut or convenience items, and a bit of waste
- Liberal if you buy organic or specialty foods, more meat and fish, and don’t plan around prices
If your number comes out well past Liberal, check what’s in it before you blame the food. A “grocery” total often includes things that aren’t groceries.
What the Numbers Leave Out
Comparing your bank statement to these tables is where most people go wrong, because the two measure different things.
Eating out. The plans assume every meal is cooked at home. Restaurants, takeout, coffee and the office vending machine are all extra.
Everything at the supermarket that isn’t food. Toilet paper, detergent, shampoo, pet food, alcohol, the phone charger by the checkout. It all sits on the same receipt as the vegetables, and your card statement lumps it under one store name.
Where you live. These are national averages. Food prices vary a lot by region, and Alaska and Hawaii have their own tables.
Time. The USDA updates the plans every month, so expect these figures to drift up a little over the year.
Work Out Your Own Number
The fastest honest comparison takes about twenty minutes and a couple of months of receipts.
- Gather two or three months of grocery receipts. Card statements give you totals, but you need the receipts to see what’s inside them — the itemized receipt, not the card slip.
- Take out the non-food lines. Cleaning supplies, toiletries, pet food, alcohol.
- Divide by the number of months and find your household’s row in the table.
Say a couple’s bank statement shows $940 a month at the supermarket. The receipts show $135 of that is household goods and $70 is wine and beer. The food bill is $735 — between Low-Cost and Moderate for a couple in their thirties, and more than $200 lower than the statement suggested.
If you land above the Liberal line even after removing the non-food items, the gap tends to live in a few categories rather than across the whole cart: snacks, drinks, ready meals. That’s where tracking grocery spending item by item pays off, and where what your grocery receipts show beats anything on your bank statement.
Checking It With Receiptix
The hard part of that exercise is step two — pulling the toilet paper out of the food bill — and it’s the part Receiptix does on its own. Photograph a grocery receipt and the AI receipt scanner reads every line. With Pro, each item lands in its own category — the detergent in Home and Living, the dog food in Pet Care, the wine in Alcoholic Drinks, the vegetables in Groceries — without you sorting a thing.
From there the monthly comparison is a chart, not a spreadsheet: food spending by month, with the non-food lines already split out, ready to hold up against the table above. Basic charts are free, and so are your first few expenses; Pro lifts the limit and adds item-level categories. There’s more on how that works in practice on the grocery expense tracker page.
The USDA tables tell you what food costs. Your receipts tell you what you buy. The useful number is the gap between the two, and it’s rarely spread evenly across the whole cart.
Note: This blog post is for informational purposes only and does not constitute financial advice. Always consult with a financial advisor for personalized guidance.