Your Spending, Broken Down
Receiptix turns your expenses into charts that actually tell you something. See spending by category to find out where your money goes. Filter by custom tags to track what's tax-deductible or reimbursable. If you're running a shared project, see what each person spent.
Pick any date range — this week, last month, Q3, the entire year — and the numbers adjust. When you need something official, generate a PDF report or export raw data as CSV.
What You Can See
Category Breakdown
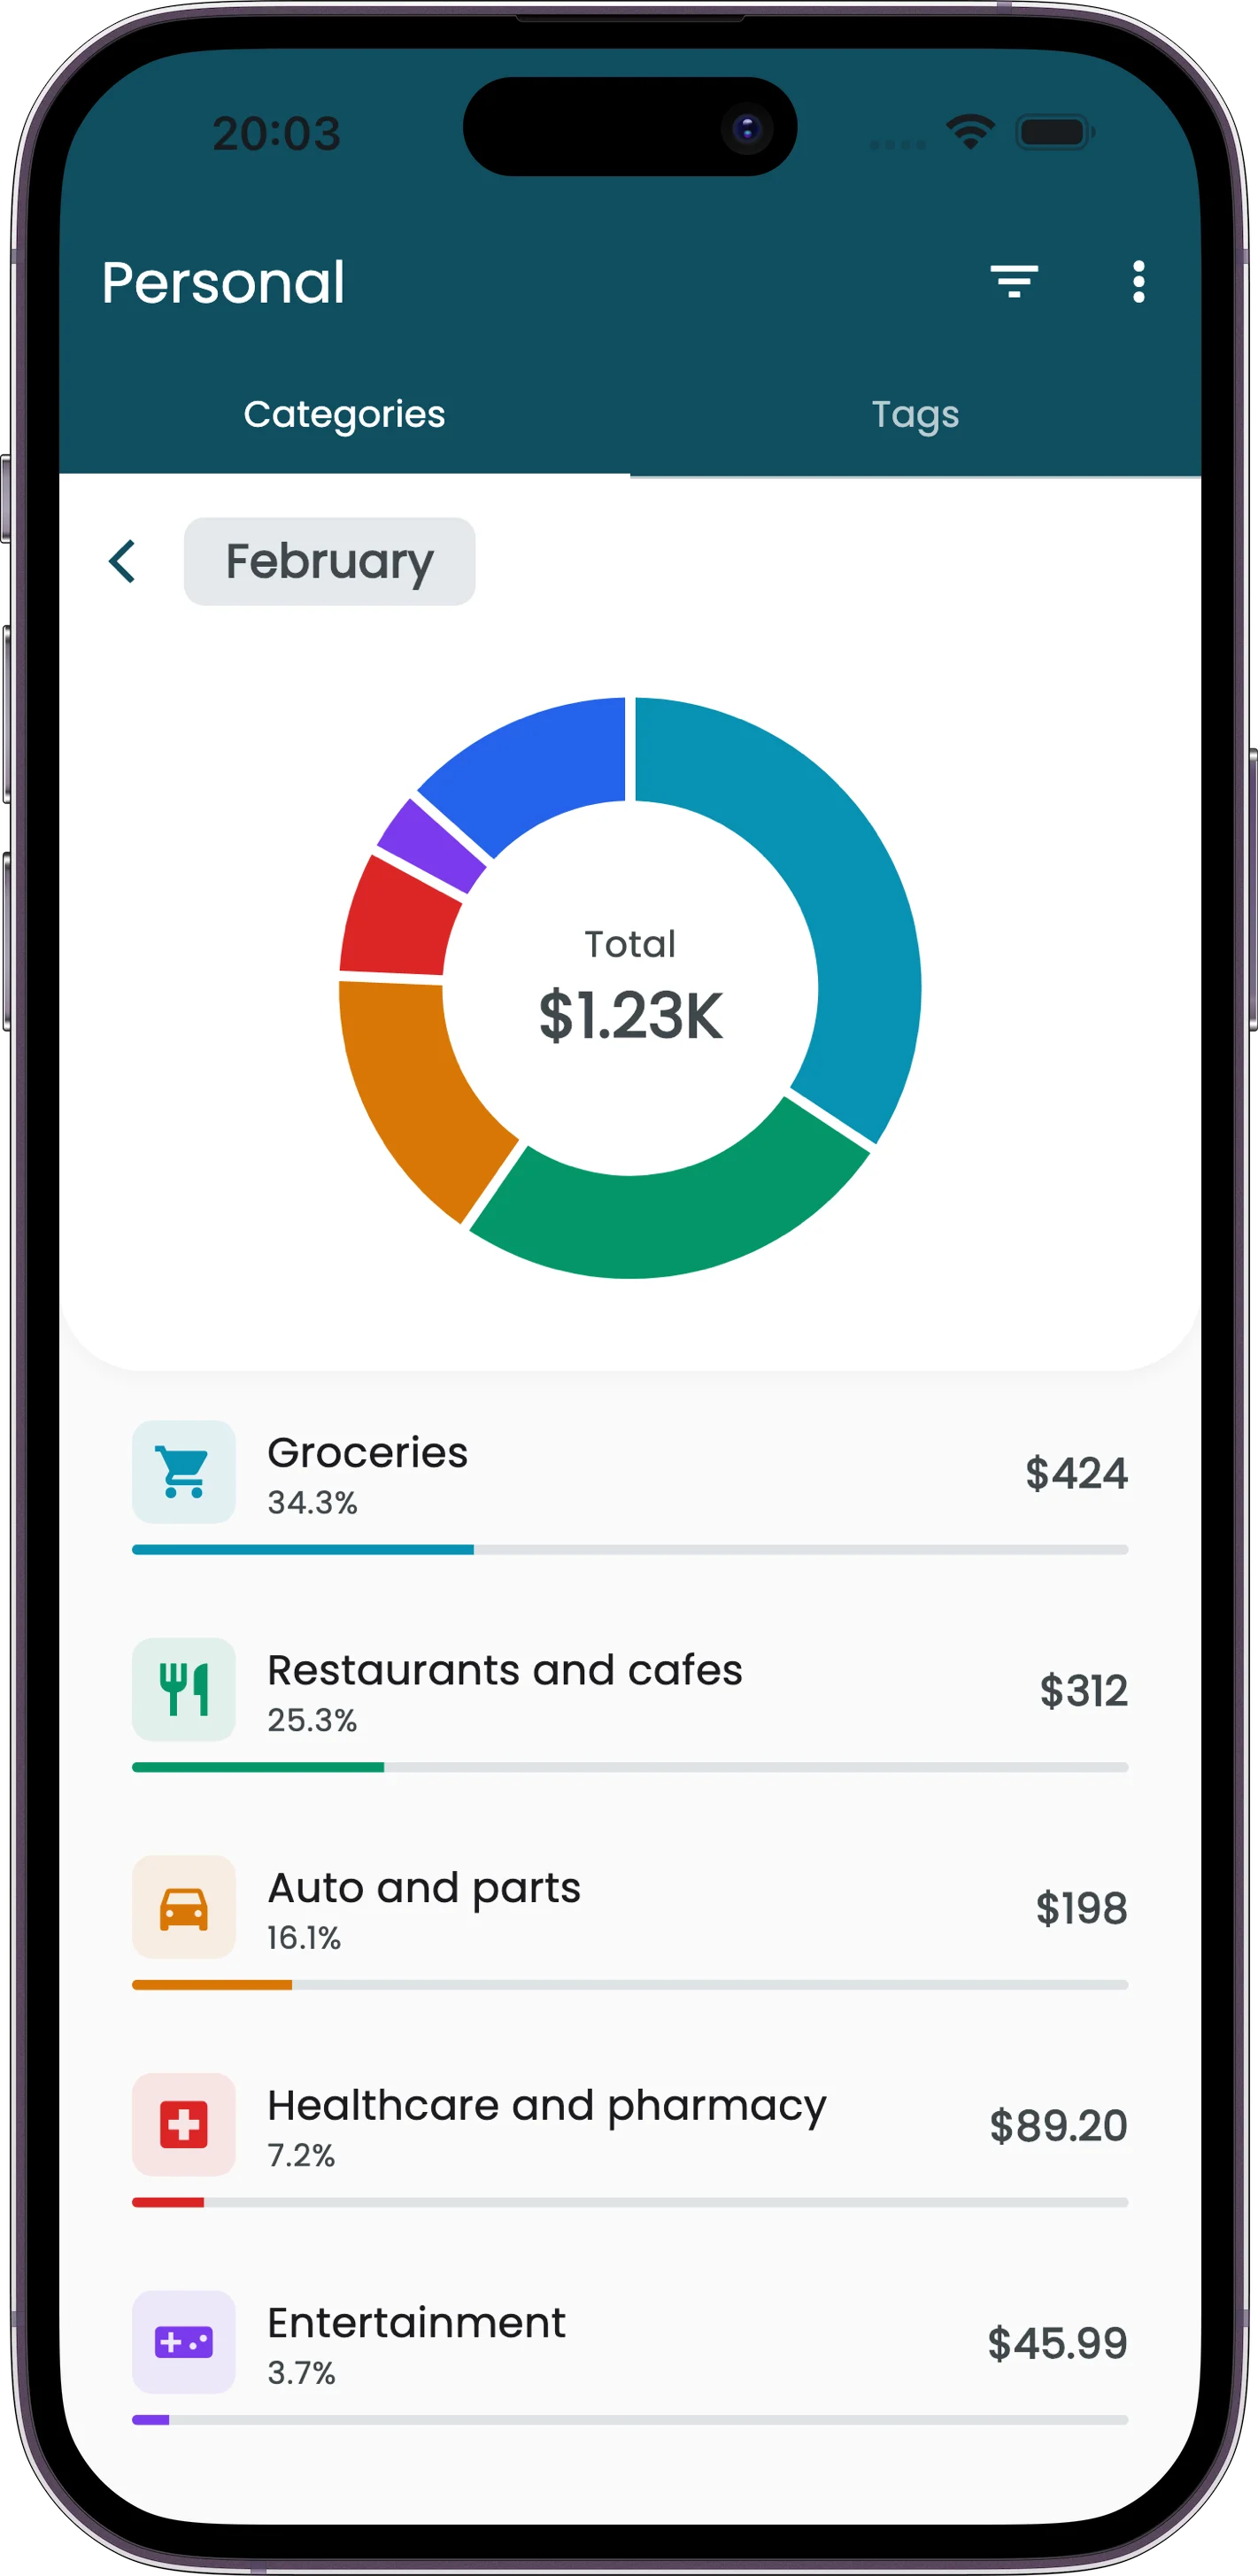
How much went to food? Transportation? Entertainment? A pie chart shows the split at a glance, with exact amounts underneath.
Tag-Based Analysis
Filter by tags like "Business," "Vacation," or "Client: Acme." See only what matters for the report you're building.
Member Spending
For shared projects: see what each team member spent. Useful for splitting costs, tracking budgets, or preparing reimbursements.
Custom Date Ranges
This month, last quarter, a specific trip. Pick any date range and the charts recalculate on the spot.
Report Types
Category Spending
Pie chart showing your spending distribution. Tap any slice to see the individual expenses in that category.
Tag Analysis
See spending grouped by your custom tags. Great for tracking project budgets, tax categories, or trip expenses separately.
Per-Member Breakdown
In shared projects, see how much each person spent. Makes settling up straightforward instead of awkward.
Export Your Data
PDF Reports
Formatted expense reports with summary stats and category breakdowns. Ready to attach to a reimbursement request, send to your accountant, or keep for tax records.
CSV Export
Raw data in CSV format. Open it in Excel, Google Sheets, or import into your accounting software. Every field, every transaction.
Who Uses Reports
Freelancers
Track business vs. personal expenses. Generate reports for tax deductions. Export for your accountant at year-end.
Teams
Shared projects with per-member tracking. See who spent what, generate group expense reports, settle up easily.
Personal Use
Find out where your paycheck actually goes. Spot the subscriptions and habits that add up over time.